A bank statement often looks less like a story and more like confetti. Rent appears next to a coffee charge, then a refund, then a yearly subscription nobody remembered buying. Merchant names don't help much. “SQ *MKT” could be lunch, office supplies, or a birthday gift bought in a hurry.
That confusion is why categories of expenditure matter. They turn a pile of transactions into something readable. Instead of staring at line items, a reader can see patterns like housing, food, transportation, healthcare, or entertainment. That's the difference between asking “Where did the money go?” and answering it.
A useful category system doesn't need to be perfect. It needs to be clear enough to help with better decisions next week, next month, and during the next surprise expense.
Table of Contents
- Why Your Bank Statement Is a Mess (And How to Fix It)
- Understanding Your Spending Building Blocks
- Two Simple Ways to Classify Every Expense
- How to Build a Custom Category System
- Categories for Couples and Shared Finances
- Implementing and Visualizing Categories in rondre
Why Your Bank Statement Is a Mess (And How to Fix It)
A typical review starts with good intentions. Someone opens a bank app to check spending, scrolls through a long list, and quickly loses the thread. A grocery trip sits next to a streaming charge, then a pharmacy run, then a payment to a friend for shared utilities. The list is complete, but it isn't organized.
That's where many find themselves stuck. The money isn't missing. It's just unlabeled.
The real problem isn't spending, it's translation
Bank statements record transactions in the order they happen. People think in groups. They want to know how much went to home costs, food, commuting, family expenses, and things that felt optional. A statement doesn't answer those questions on its own.
Three common problems show up again and again:
- Cryptic merchant names make ordinary purchases hard to recognize.
- Mixed purchases blur categories. One big-box store trip might include groceries, cleaning supplies, and a phone charger.
- Irregular charges hide in plain sight. Annual renewals and quarterly bills don't feel important until they land.
A messy statement doesn't mean someone is bad with money. It usually means the raw data hasn't been sorted yet.
Categories create a map
Categories of expenditure act like labeled drawers. Once transactions go into the right drawers, the spending pattern becomes visible. Housing can be separated from dining out. Work-from-home costs can be separated from household basics. Shared bills can be separated from personal spending.
That small change creates practical benefits:
- Faster reviews because similar transactions sit together.
- Cleaner decisions because cuts and adjustments become easier to see.
- Less stress because recurring costs stop feeling random.
A category system also helps with hindsight and planning at the same time. It explains what happened, then gives a structure for what to watch next. That's why categorization is less of a bookkeeping chore and more of a translation tool.
Understanding Your Spending Building Blocks
A useful way to understand categories of expenditure is to think about organizing a kitchen. Nobody throws frozen vegetables, cereal, olive oil, and dish soap into one giant bin and calls it “stuff.” People separate food by where it belongs and how it's used. Pantry items go on one shelf. Fridge items go in another. Inside those spaces, things get grouped again.
Spending works the same way.

A category is just a label with a job
At the top level, a person might have broad groups like Housing, Food, and Transportation. Under each one, there can be smaller sub-categories.
For example:
- Housing could include rent or mortgage, utilities, and home supplies
- Food could include groceries and dining out
- Transportation could include fuel, public transit, parking, and maintenance
The broad label gives a summary. The smaller label gives detail.
That structure isn't just a personal finance trick. The Bureau of Labor Statistics Consumer Expenditure Surveys formally track household expenditures, income, and demographics, and use broad categories such as housing, transportation, food, healthcare, apparel, and entertainment. That matters because it shows that categorization is how spending gets understood at scale, not just in a budgeting app.
Broad first, detailed second
Readers often get confused about how many categories they need. The easiest answer is to start broad, then add detail only where it helps. A category should earn its place.
A practical test helps:
| Question | If the answer is yes | If the answer is no |
|---|---|---|
| Does this type of spending happen often? | Give it its own sub-category | Keep it under a broader group |
| Would seeing it separately change decisions? | Split it out | Leave it combined |
| Is it easy to identify from transactions? | Automate or label it consistently | Keep the system simpler |
Practical rule: If a category won't change a decision, it probably doesn't need to exist yet.
A good category system should feel like an organized pantry, not a warehouse inventory. It should be easy to maintain and easy to scan. If the structure becomes too detailed, people stop using it. If it stays too broad, “miscellaneous” starts swallowing everything.
Two Simple Ways to Classify Every Expense
Not all categories answer the same question. Some help with prediction. Others help with priorities. Two frameworks do most of the heavy lifting: fixed vs. variable and needs vs. wants.

Fixed and variable answer different questions
In accounting, expenses are often split into fixed and variable because they behave differently. Fixed costs such as rent and salaries stay relatively constant, while variable costs such as cost of goods sold and commissions move with output or sales, as explained in this expense categories overview from Versa Cloud ERP.
For a household, that idea still works well:
- Fixed expenses are the charges that tend to show up at similar amounts, like rent, insurance, or a phone plan.
- Variable expenses move around, like groceries, fuel, rideshares, takeout, or entertainment.
This framework helps answer one question: How stable is monthly cash flow?
If income drops or a surprise expense appears, variable spending usually changes first. Fixed spending takes longer to reduce because it often involves contracts, leases, or bigger life changes.
Needs and wants help with tradeoffs
Needs vs. wants is different. It doesn't ask whether a bill changes. It asks whether it's essential.
A few examples make the distinction easier:
- Rent is usually fixed and a need
- Groceries are usually variable and a need
- Streaming services are often fixed and usually a want
- Dining out is usually variable and usually a want
That's why these two models work better together than alone. Fixed vs. variable shows what can shift quickly. Needs vs. wants shows what should be protected first.
For readers trying to sort flexible spending more clearly, this guide on what discretionary spending means in practice can help separate the optional from the essential.
Fixed and variable describe behavior. Needs and wants describe priority.
A category can belong to both systems at once. That's not messy. That's useful. One label explains how the expense behaves. The other explains how hard it would be to cut.
How to Build a Custom Category System
A category system works best when it reflects real life, not an idealized spreadsheet. Individuals don't need a universal chart of accounts. They need a short list that matches the way money moves through their month.
Start with what already happened
The cleanest starting point is recent transaction history. Reviewing the last few months usually reveals the core spending groups quickly. Rent, groceries, utilities, commuting, healthcare, subscriptions, shopping, and transfers often appear early.
The important thing is to look for repetition, not perfection.
A simple process works well:
- Scan transactions for repeats. Recurring merchants often become the backbone of the system.
- Circle the hard items. Amazon orders, bundled subscriptions, reimbursements, and annual charges need special handling.
- Create broad groups first. Housing, Food, Transportation, Health, Personal, Shared Bills, and Work can cover a lot.
The hard part usually isn't the top five categories. It's the leftovers. Real spending now includes overlapping buckets like bundled subscriptions, work-from-home costs, and shared household bills. The BLS consumer expenditures report for 2023 notes that the five largest categories absorb 83.2 cents of every dollar, which makes the remaining spend the place where category mistakes and confusion tend to pile up.
Use enough detail, but not too much
A useful category system should be detailed enough to answer real questions.
Examples:
- If takeout keeps surprising the budget, split Dining Out from Groceries
- If freelance costs mix with household spending, separate Work Expenses
- If yearly charges keep causing stress, create Irregular Bills and treat them consistently
What usually fails is the middle ground nobody defines. “Miscellaneous” becomes a junk drawer. One transaction gets labeled as shopping this month, home next month, and gifts during the holidays.
The category name matters less than the rule behind it. Consistency beats cleverness.
A practical guide to tracking expenses with a repeatable system can help turn those category rules into daily habits.
Sample CSV-Friendly Category Structure
This format is simple enough for a spreadsheet, clean enough for CSV imports, and flexible enough to evolve.
| Main Category | Sub-Category | Example Transaction |
|---|---|---|
| Housing | Rent or Mortgage | Monthly landlord payment |
| Housing | Utilities | Electric bill |
| Food | Groceries | Supermarket purchase |
| Food | Dining Out | Cafe or restaurant charge |
| Transportation | Fuel or Transit | Gas station or train ticket |
| Transportation | Maintenance | Tire replacement |
| Health | Pharmacy | Prescription refill |
| Personal | Shopping | Clothing store purchase |
| Subscriptions | Streaming | Video or music service |
| Shared Bills | Internet | Household broadband bill |
| Work | Home Office | Desk lamp for work use |
| Irregular Bills | Annual Renewals | Yearly software or membership fee |
When a transaction could fit two places, a written rule solves the problem. For example, one household might put all internet costs under Shared Bills. Another might split internet and mobile service. Either choice works if it stays consistent.
Categories for Couples and Shared Finances
Shared finances rarely break down because people can't name categories. They break down because one transaction means different things to different people. A grocery run might include dinner ingredients, shampoo, and a school supply. A credit card bill might include shared rent, one partner's coffee purchases, and a freelance expense that should've stayed separate.

A shared category system reduces friction
For couples, families, and freelancers, the practical challenge is often how to separate, split, and label transactions so they remain useful over time. Some expenses are context-dependent, and some are explicitly unallowable in business settings, including examples such as travel or alcohol in certain contexts, as shown in Stanford's guidance on unallowable expenditure types. That's why blended personal, household, and work spending can get messy fast.
A shared system works better when it answers three questions clearly:
- Is this shared or personal
- If shared, which household bucket does it belong to
- If mixed, what rule will be used every time
A simple structure that holds up over time
Many households do well with a structure like this:
- Shared Bills for rent, utilities, internet, insurance
- Shared Living for groceries, household supplies, pet basics
- Shared Fun for date nights, family outings, streaming services
- Personal Spending for each person's individual purchases
- Work or Business for reimbursable or income-related costs
That approach creates room for transparency without turning every purchase into a negotiation.
A couple using a shared tracker also gets a practical advantage. One person can import transactions, the other can review and label, and both can see the same category structure. For households exploring that setup, this article on an expense tracker for couples offers examples of how to divide shared and individual spending without losing clarity.
Shared finances work better when the system settles recurring questions before emotions get involved.
Implementing and Visualizing Categories in rondre
A category plan becomes useful when it's attached to actual transactions. That's where tools matter. A tracker should make it easy to label spending, catch repeat merchants, and show the results in a format that's easy to read at a glance.
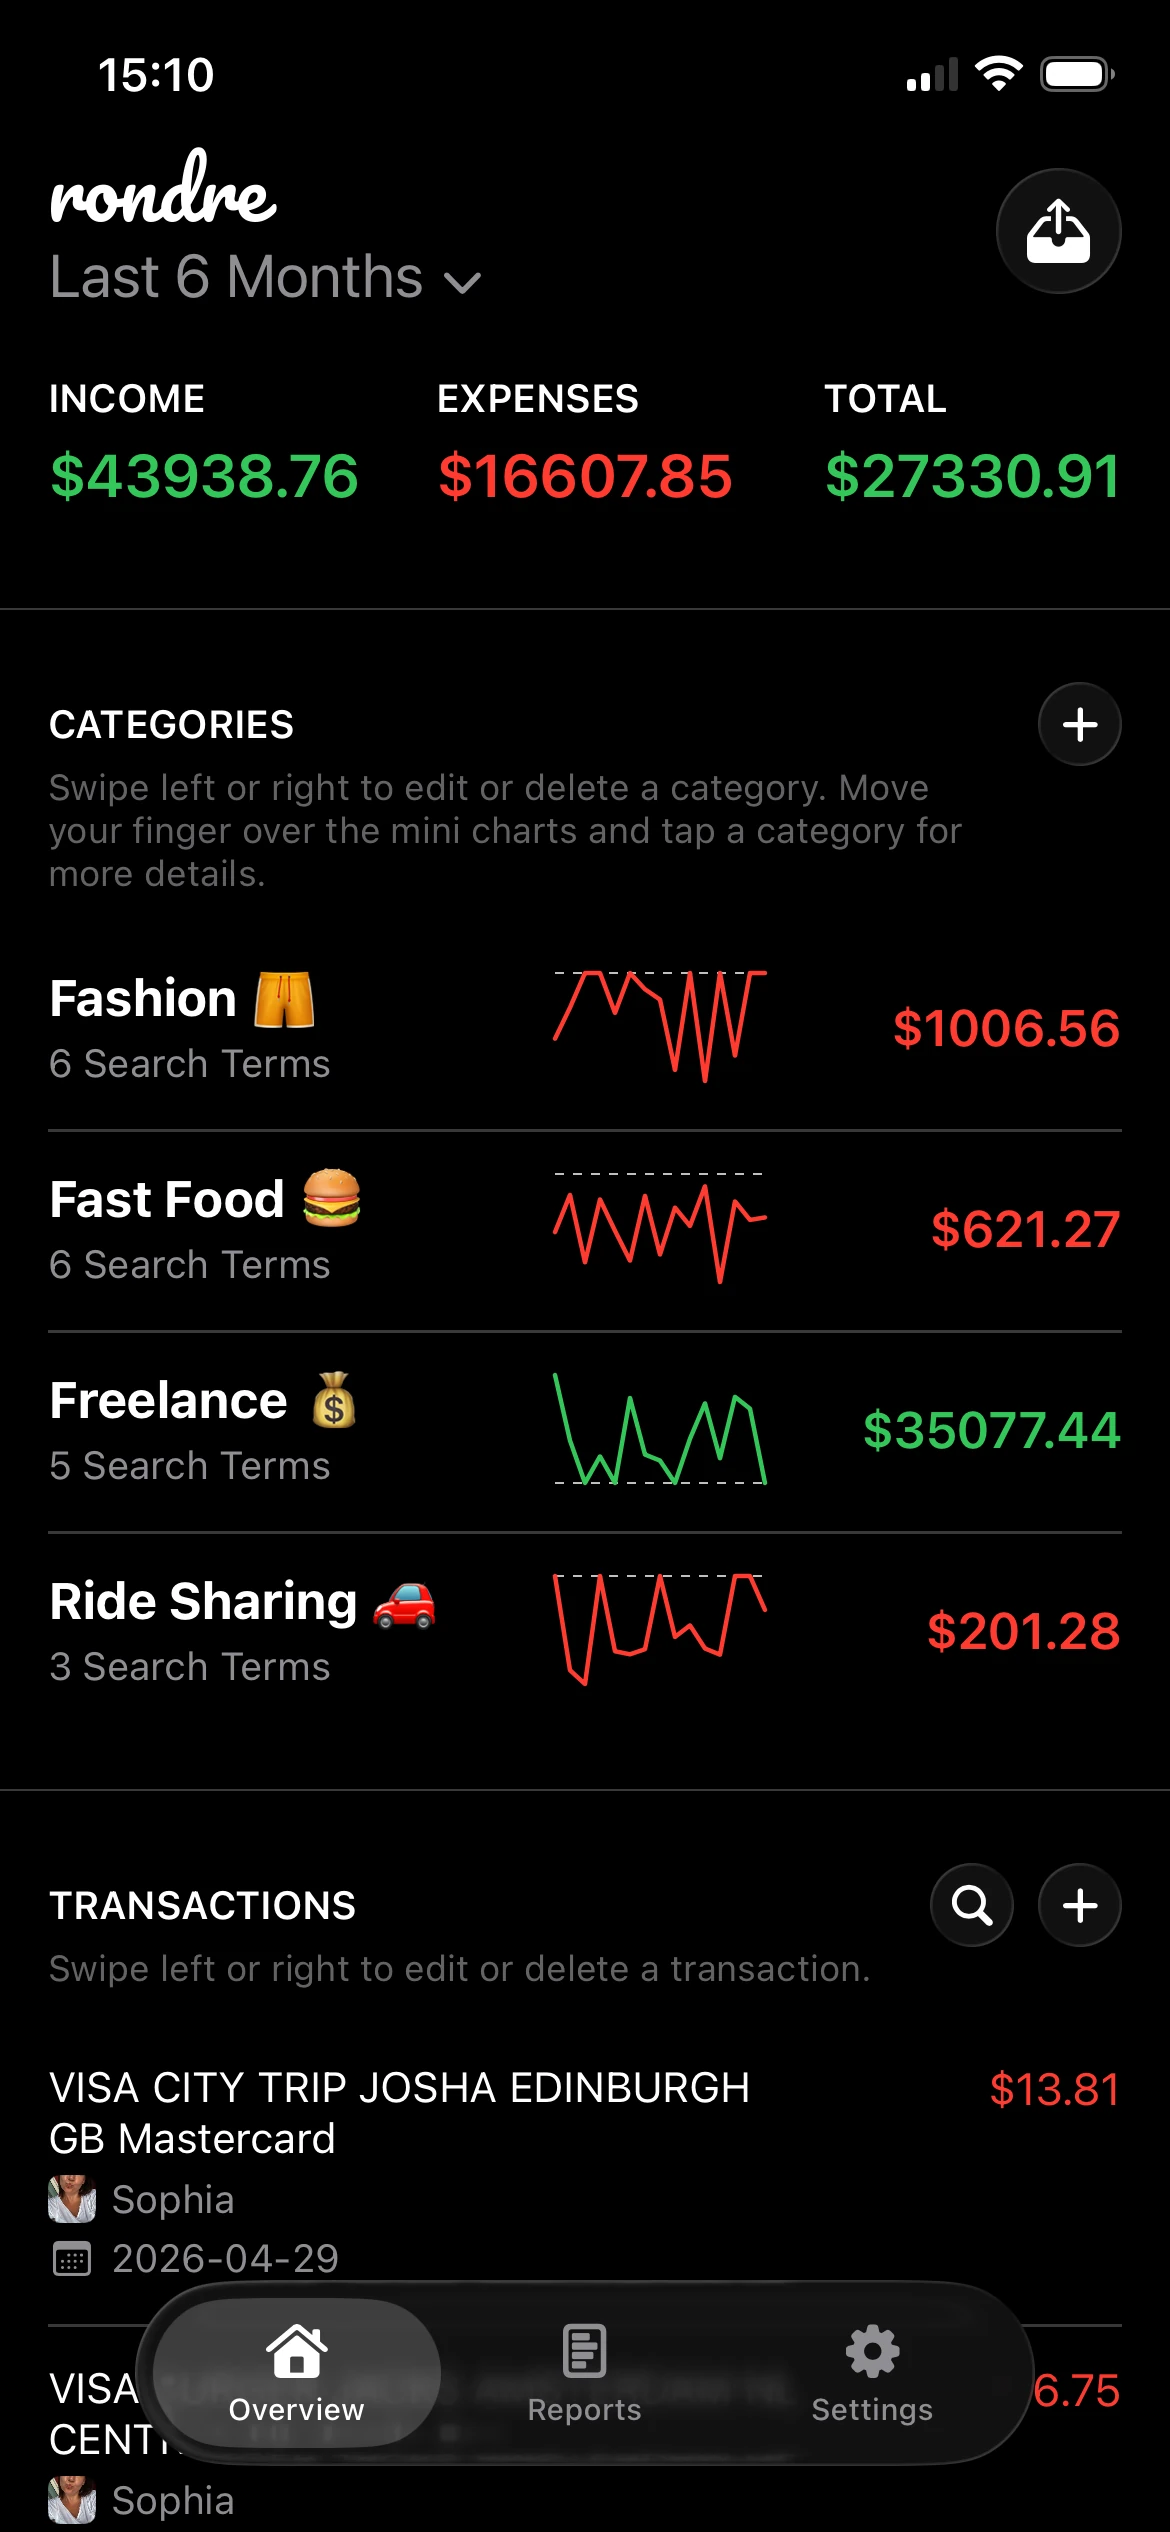
Set up categories that catch repeat spending
In rondre, users can track income and expenses, create smart categories with custom search terms, upload CSV files and PDF bank statements, search transactions instantly, and share a book with a partner or family. Because the app works without ads, tracking, or sign-up, it fits well for readers who want a private setup that starts quickly.
A practical setup looks like this:
- Create the top-level categories first. Housing, Food, Transportation, Health, Shared Bills, and Personal are enough to begin.
- Add smart search terms. A grocery chain can map to Groceries. A transit operator can map to Transportation. A streaming merchant can map to Subscriptions.
- Import older transactions. CSV files and PDF statements help populate the history so patterns appear faster.
- Review edge cases manually. Mixed purchases, refunds, and one-off transfers still need human judgment.
That process matters because the category system becomes self-reinforcing. Each recurring merchant gets easier to classify. Each month becomes easier to compare with the last.
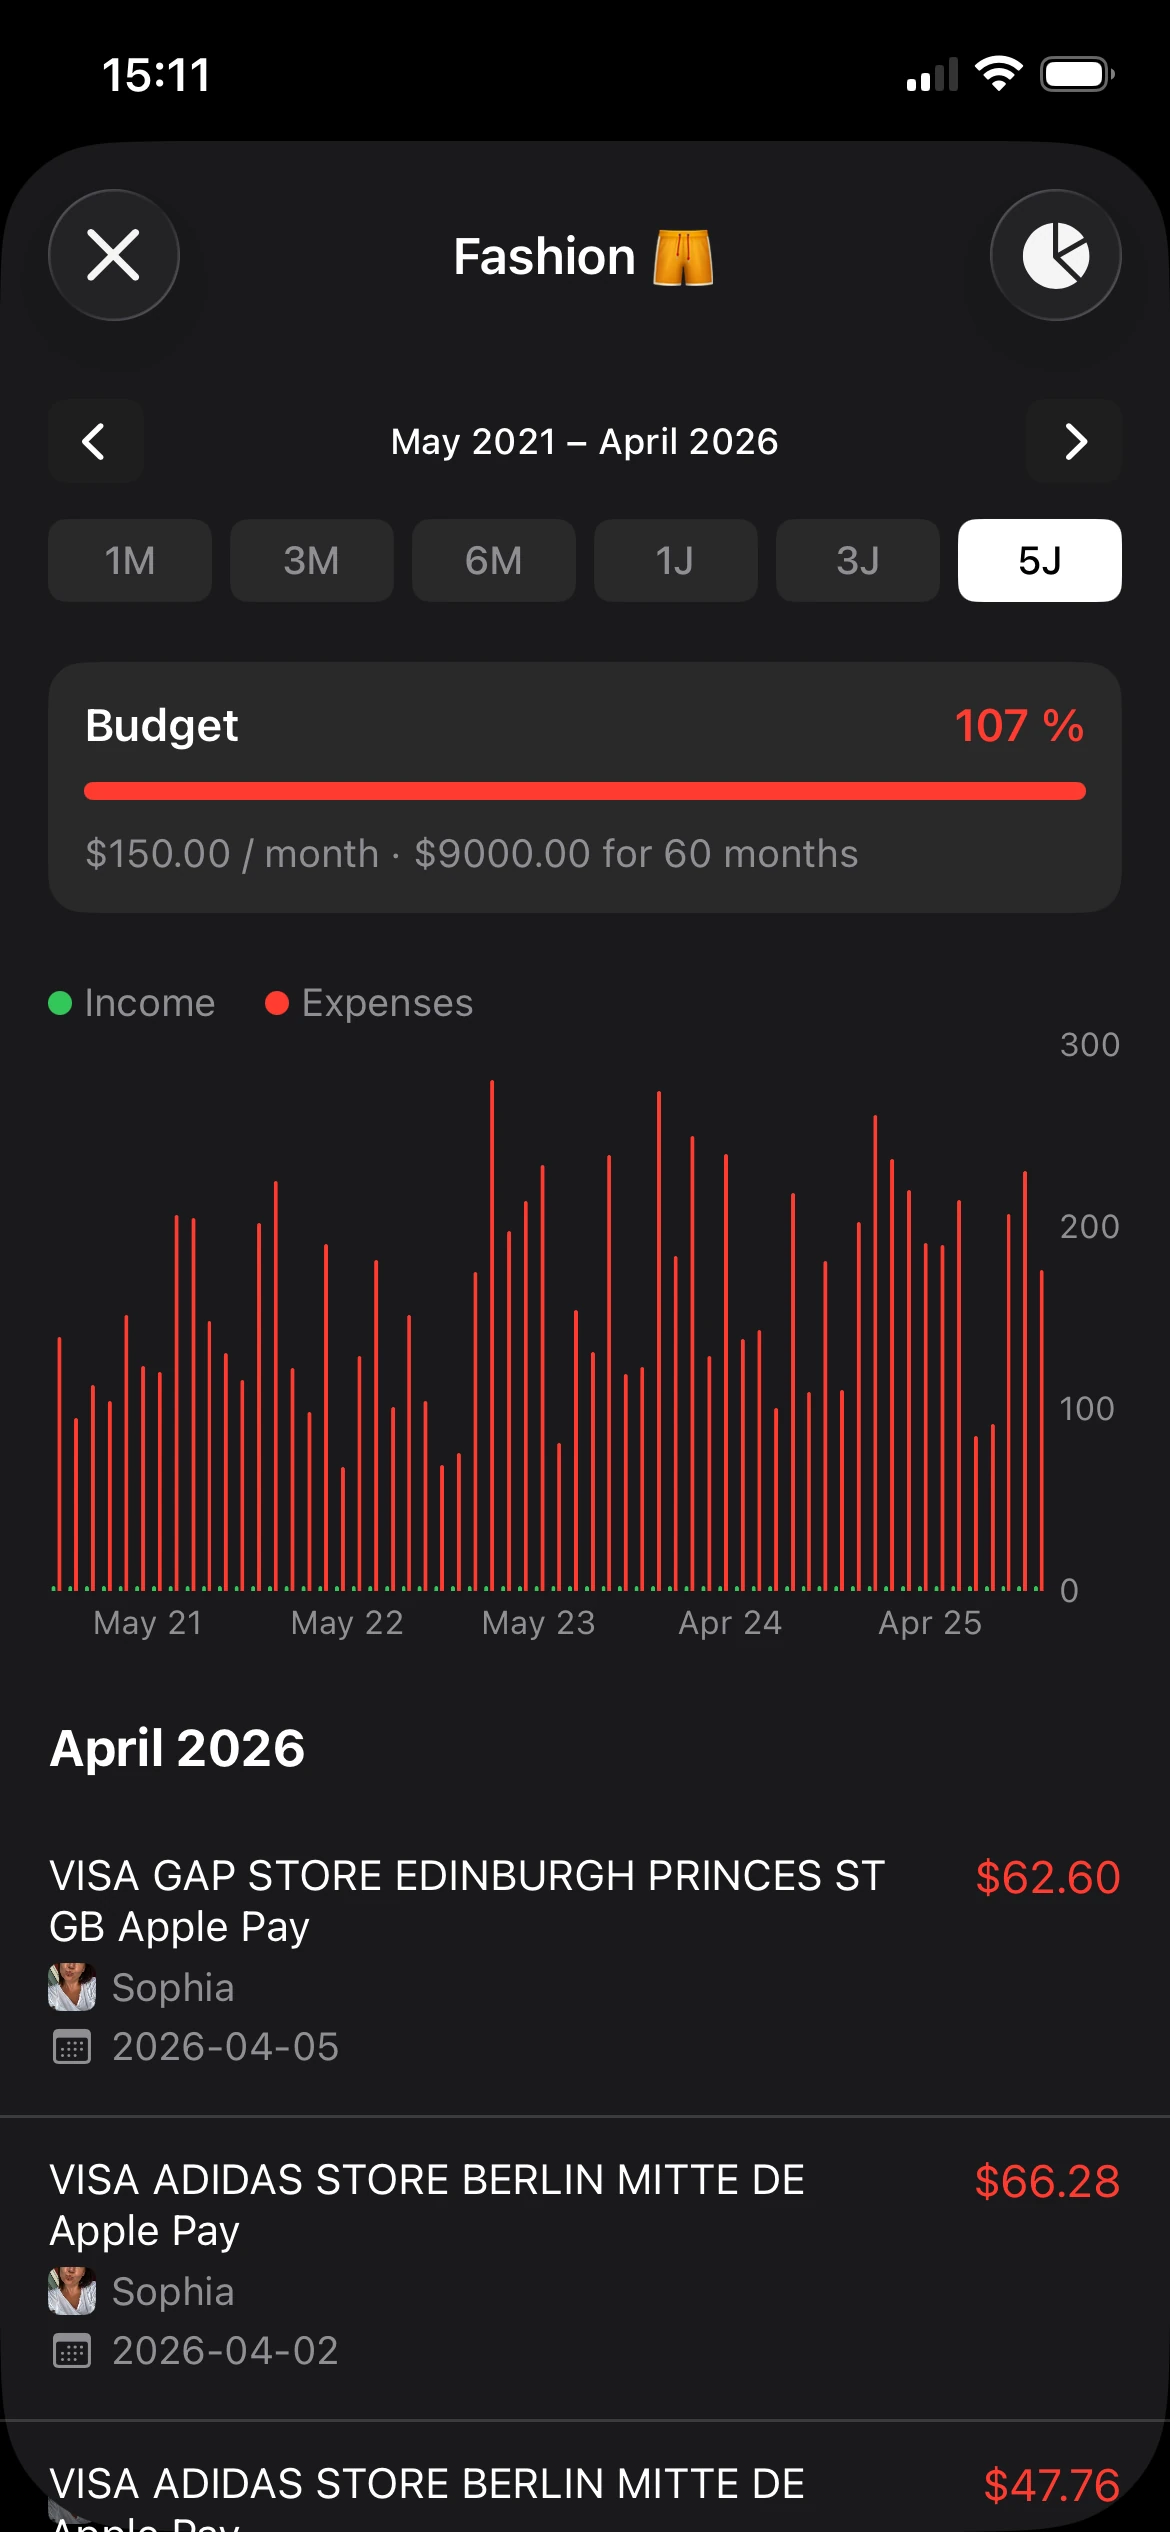
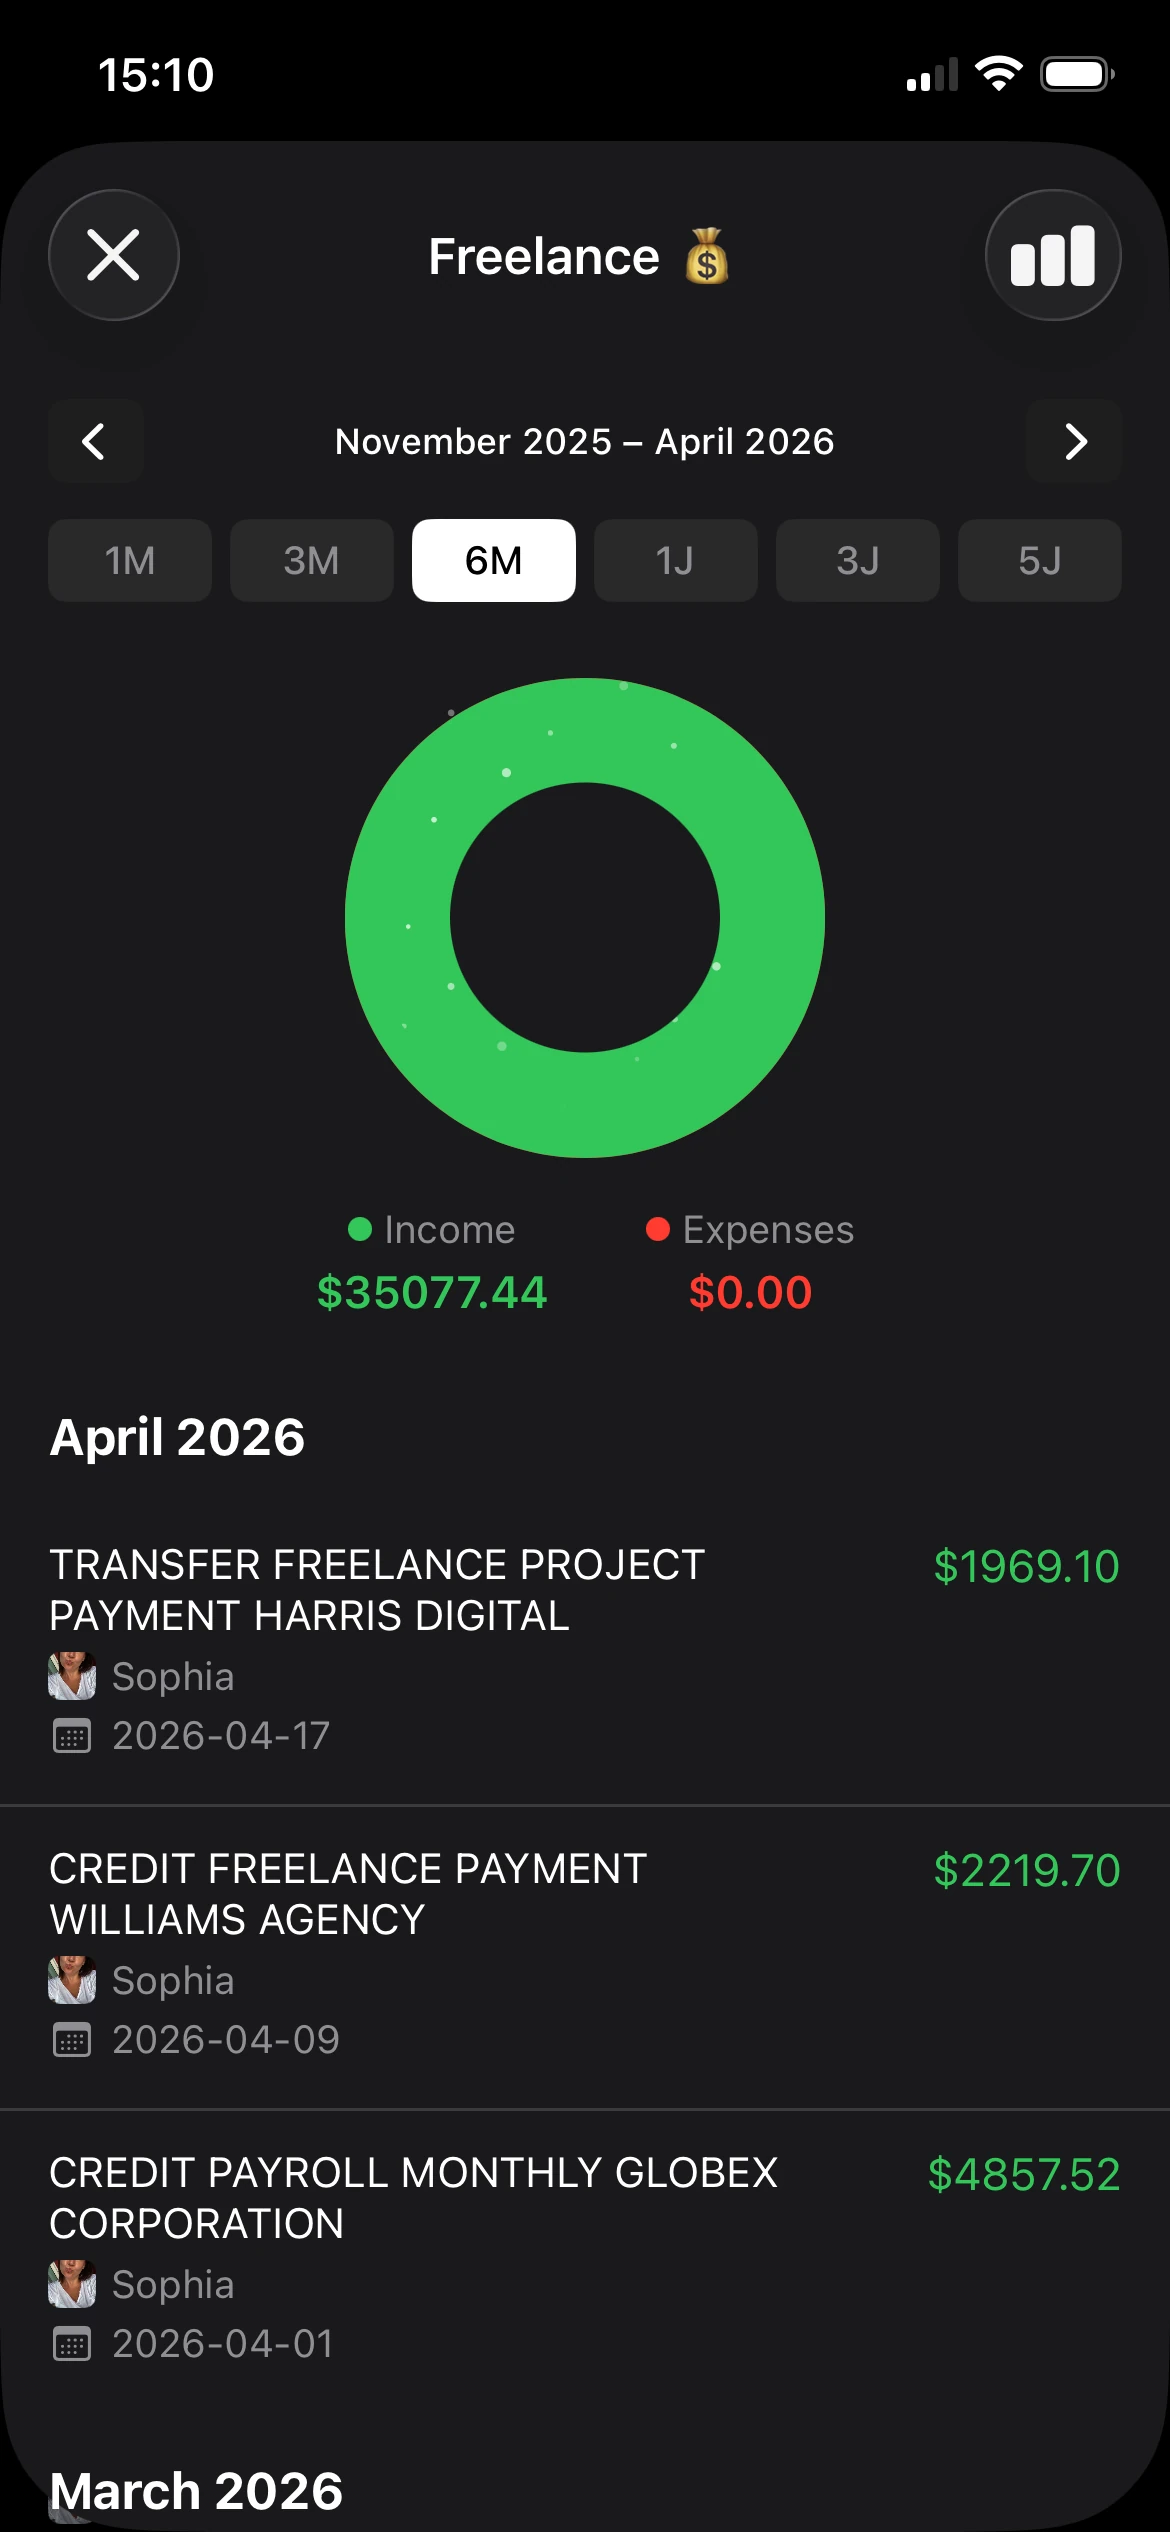
Use charts to spot pressure points fast
Once transactions are categorized, simple visuals do a lot of work. A donut chart can show the rough share of spending by category. A bar chart can reveal whether groceries are climbing or whether transportation spiked because of repairs.
Housing is often the largest expenditure category, with common planning targets around 25 to 35% of income, according to this consumer budgeting benchmark overview. That makes housing a good example of why category charts matter. If the housing slice is taking up more space than expected, the household can quickly see whether discretionary categories need to tighten to preserve cash flow.
A chart won't make the decision. It will make the tradeoff visible.
When categories are clear, a chart stops being decoration and starts becoming a decision tool.
A practical next step is simple. Download rondre, create five categories that match real life, import a recent statement, and label the transactions that repeat most often. Even a short setup can turn a confusing bank history into a financial picture that's clear enough to act on today.